Integrating ELK Stack with IBM App Connect: A Comprehensive Guide
Written by : Madiha Shujaat (Consultant • H - Integration Frameworks)
November 06, 2023
In the world of fin-tech, where money moves swiftly and data is essential, making sure everything flows smoothly is a top priority. As someone who works with financial technology, I faced a common challenge: how to keep an eye on IBM App Connect Enterprise (ACE) and make sure it's running smoothly. Let's dive into how we used the ELK Stack to make things easier.
Each application generates its own set of logs, metrics, and events. With a lack of centralized monitoring, you often find yourself jumping between different platforms to understand the performance of individual components. With the increase in applications, the data sources grow, and maintaining this manual monitoring approach becomes unsustainable. There's a pressing need to streamline data collection, analysis, and visualization to enable quick decision-making and proactive issue resolution.
What is IBM App Connect?
IBM App Connect is an integration platform designed to connect various applications and services seamlessly. By integrating ELK with IBM App Connect, organizations can centralize their data from different sources, enabling real-time analysis and monitoring. This integration empowers businesses to make data-driven decisions promptly.
Understanding the ELK Stack
Before diving into the integration process, let's briefly explore each component of the ELK stack:
- Elasticsearch: A distributed, open-source search and analytics engine that provides real-time indexing and lightning-fast search capabilities.
Elasticsearch download from the link, unzip the folder and follow the steps:
- Logstash: A Pipeline which processes data by defining its input source can perform mapping by adding filters and output destination.
Logstash download from the link and unzip it.
- Kibana: A data visualization platform that enables users to interact with data stored in Elasticsearch through visually appealing dashboards and charts.
Kibana download from the link, unzip the folder and follow the steps:
Preparing Environment
Below is listed a step-by-step guide to preparing and setting up the environment for the integration process.
a.Setting up Elasticsearch
- Go to elastic search/bin and open cmd to run the following command to install elastic search:
elasticsearch.bat
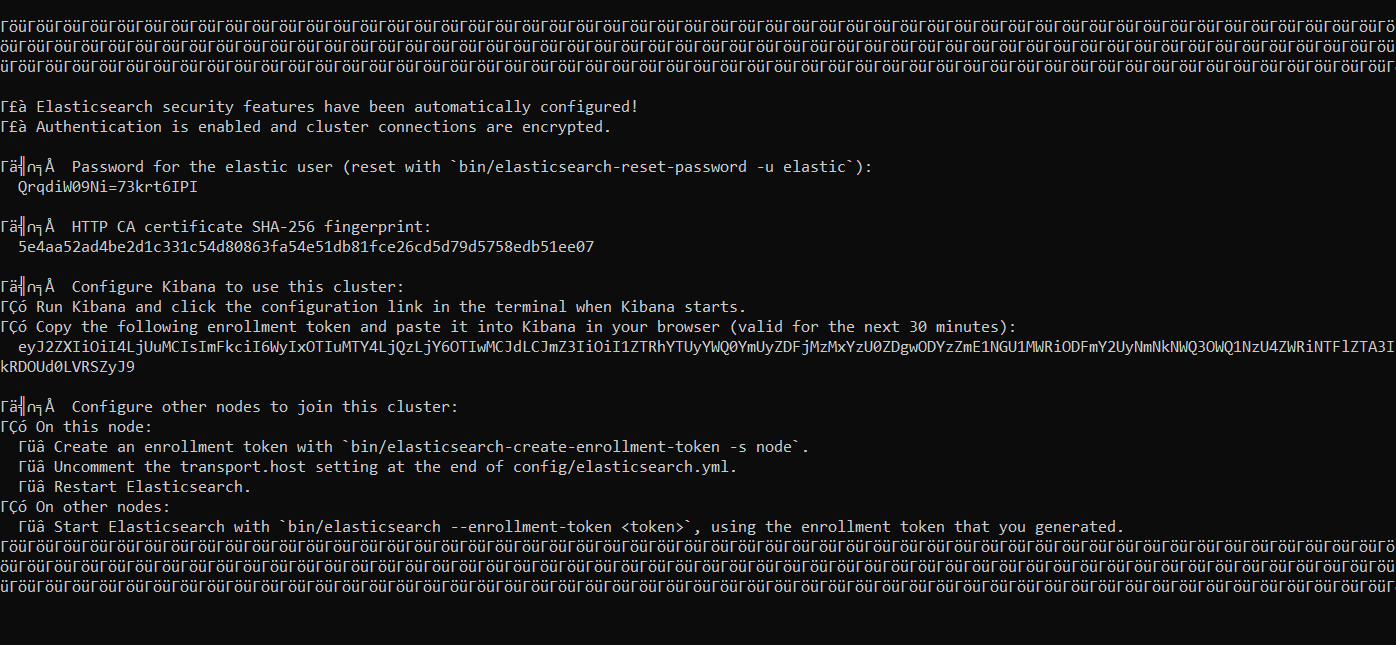
- Copy the configuration you are provided including username password for elastic and token for the future.
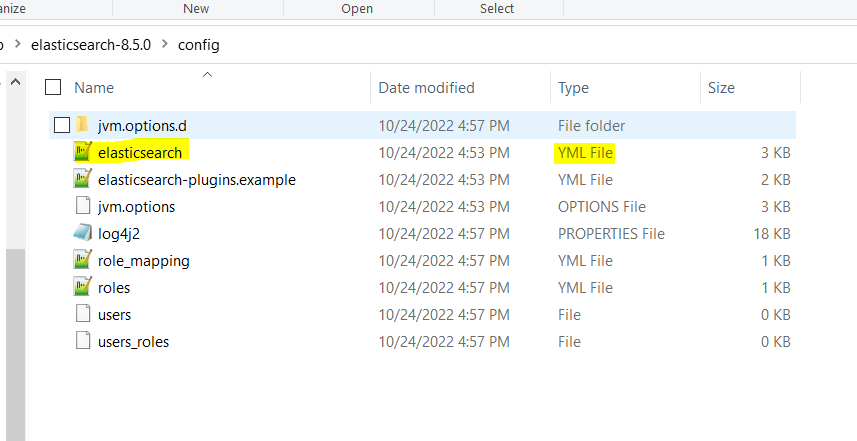
Edit the YML file present in Elasticsearch/config 'elasticsearch.yml' and turn of the certificates by disabling the security checks
- xpack.security.http.ssl:
enabled: false
xpack.security.transport.ssl:
enabled: false
- Save the yml file and re-run the elasticsearch.bat command on the same location.
Now, Verify the installation by browsing the http://localhost:9200
b. Setting up Kibana
1. Go to elastic search/bin and open cmd to run the following command to get the password for kibana user:
elasticsearch-reset-password -u kibana_system
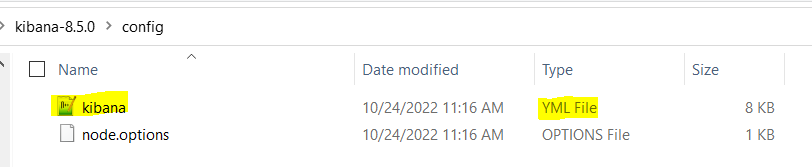
2. Edit YML file present in kibana/config 'kibana.yml'
elasticsearch.hosts: ["http://localhost:9200"]
elasticsearch.username: "kibana_system"
elasticsearch.password: "your password"
3. Go to kibana/bin and open cmd to run the following command:
kibana.bat
- Now, Verify the installation by browsing the http://localhost:5601
- Log in using the username and password provided by Elasticsearch which you have copied.
c. Setting up Logstash
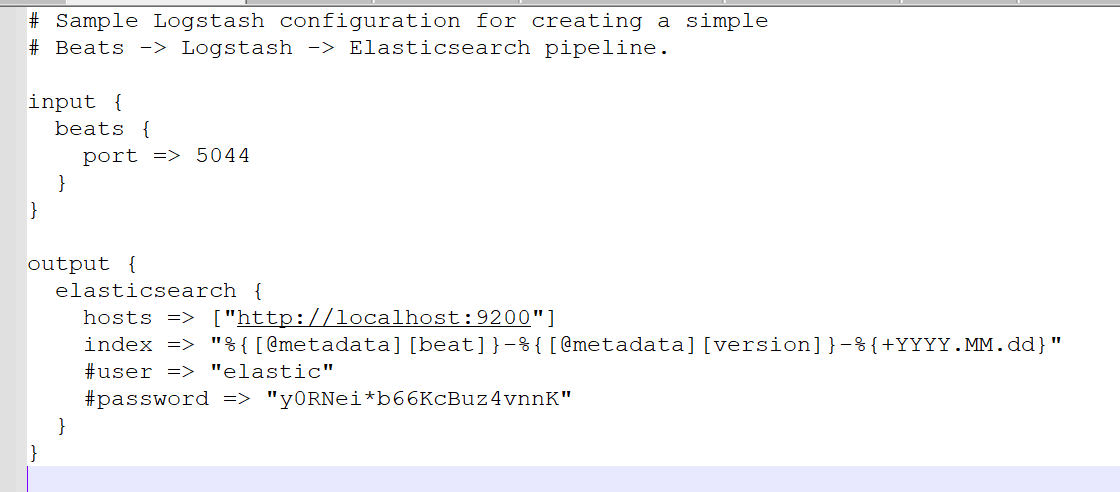
Create a ‘.conf’ with any name and define the input and output configuration at logstash/config:
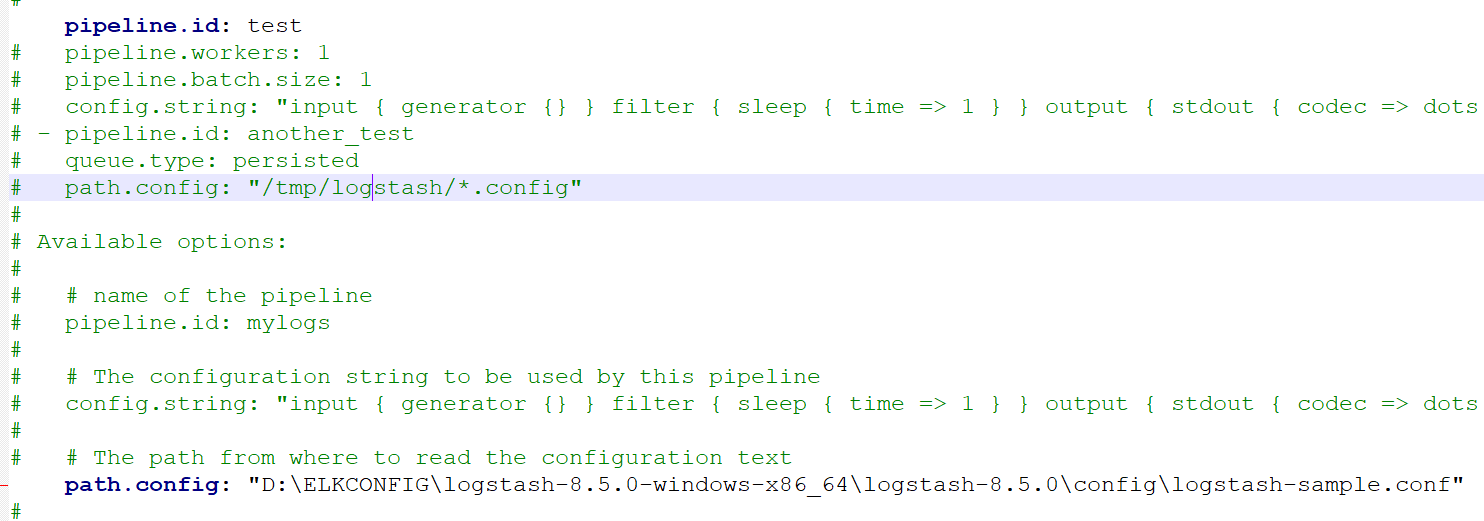
2. Now create a pipeline by editing pipeline.yml present in logstash/config:
3. Now run the following command in logstash\bin by cmd:
Logstash.bat -f <path>\logstash-samp.conf
Setting up file beats:
First, we will edit the filebeat.yml file located in the base folder, then:
- We will add the path where our logs are generated and enable the input configuration to TRUE
- Define the host address for kibana under setup.kibana:
“http://localhost:5601" - Define host address, protocol(http or https), username and password for elasticsearch under output.elasticsearch.
- Run the following command in basefolder: filebeat.exe
Establishing the Integration
Creating a REST API to generate logs
The Rest API will get data from Input and generate a log file using a trace node, you are free to use any log file any trace file for this implementation you can do event monitoring or use server trace or user trace

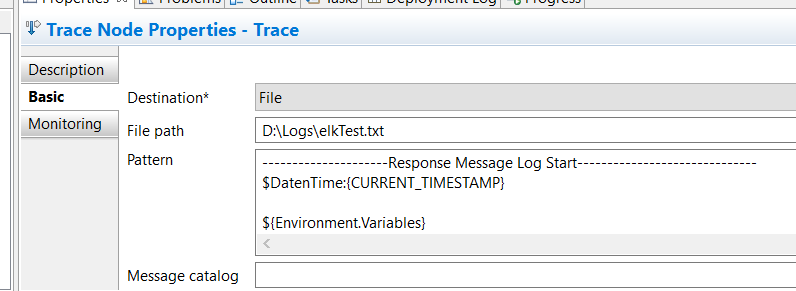
Here in Trace Node properties, I have defined what I want in my logs and the path where I want my log file to be generated
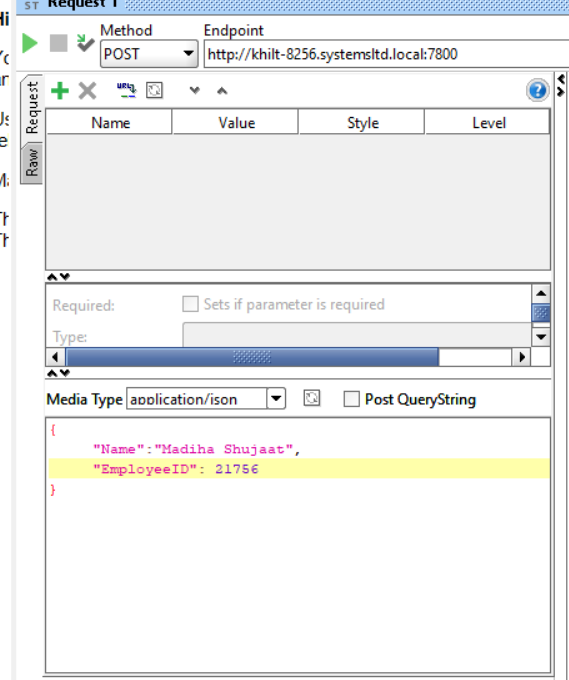
After deploying the Rest API I have to send the following data to the API
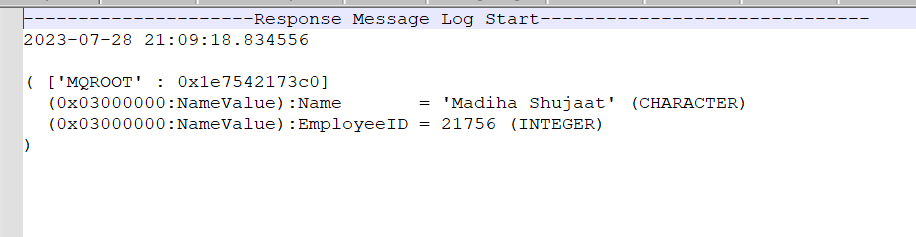
Which is then logged in the file as:
Setting up Kibana to view logs and dashboard
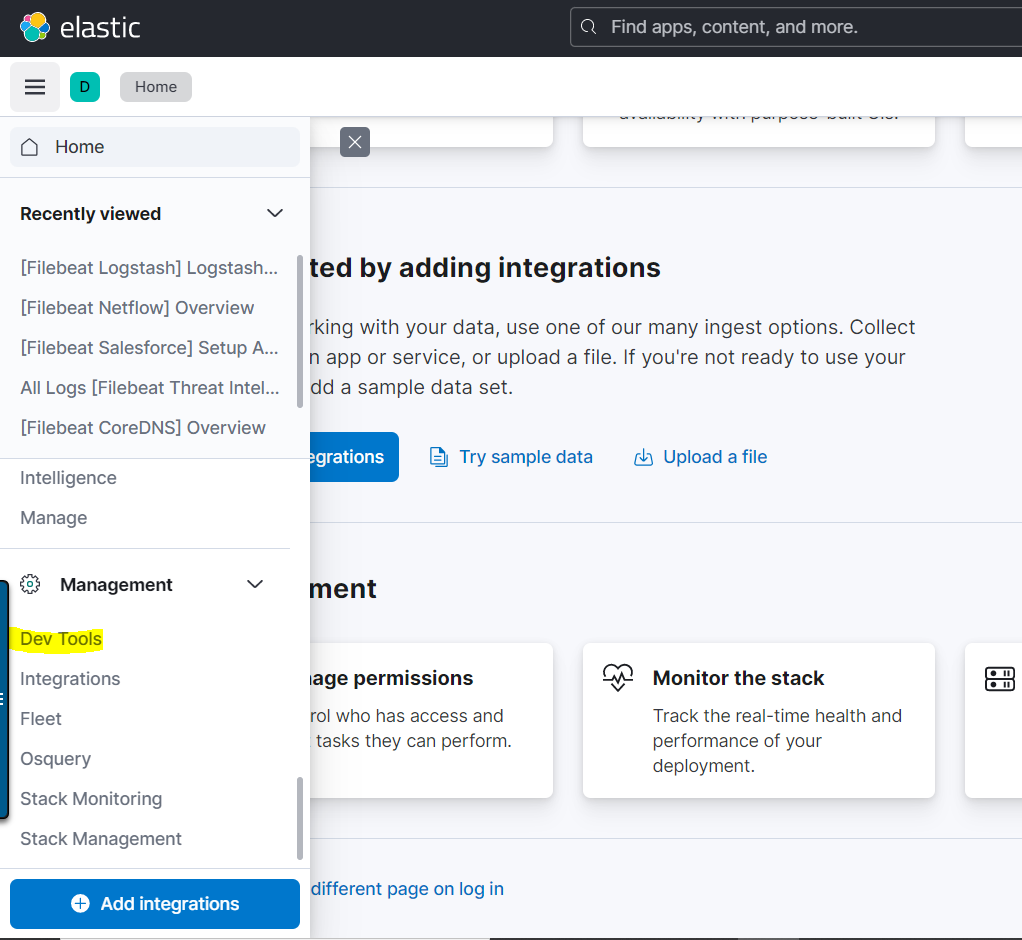
Now, go to the Kibana dashboard then the following path under management>devtools:
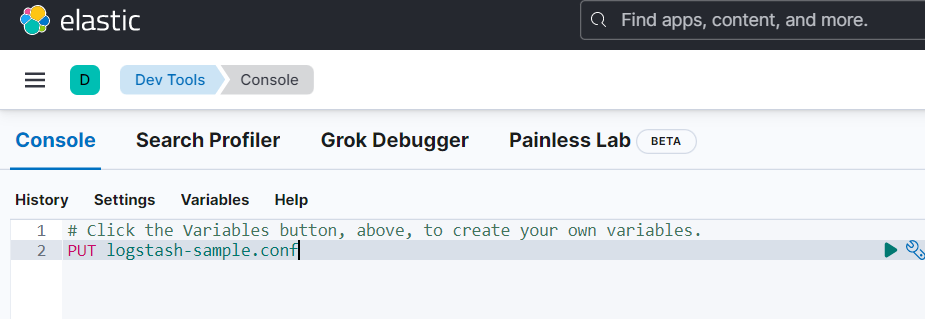
Now we will put our conf file which defines inputs and outputs to create index of logs.
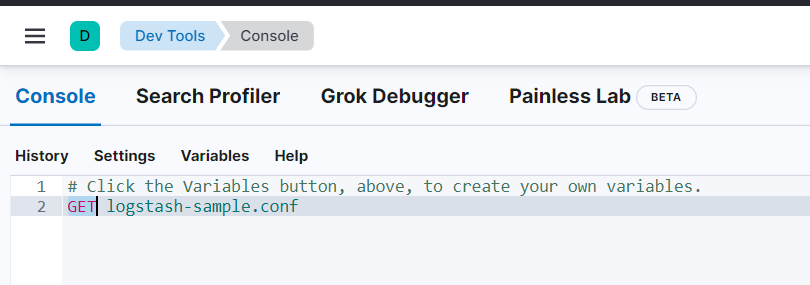
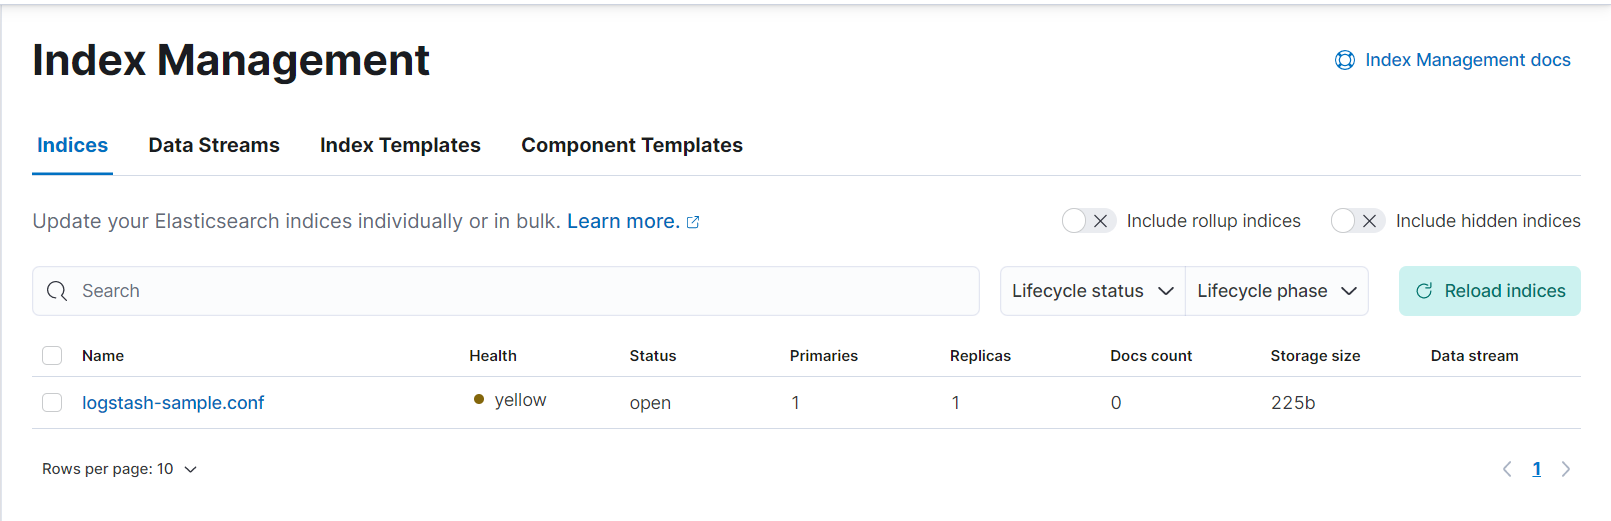
Now go to home page and browse for index management, your index file for logging should be successfully created:
Now go to Analytics > discover to see your logs:
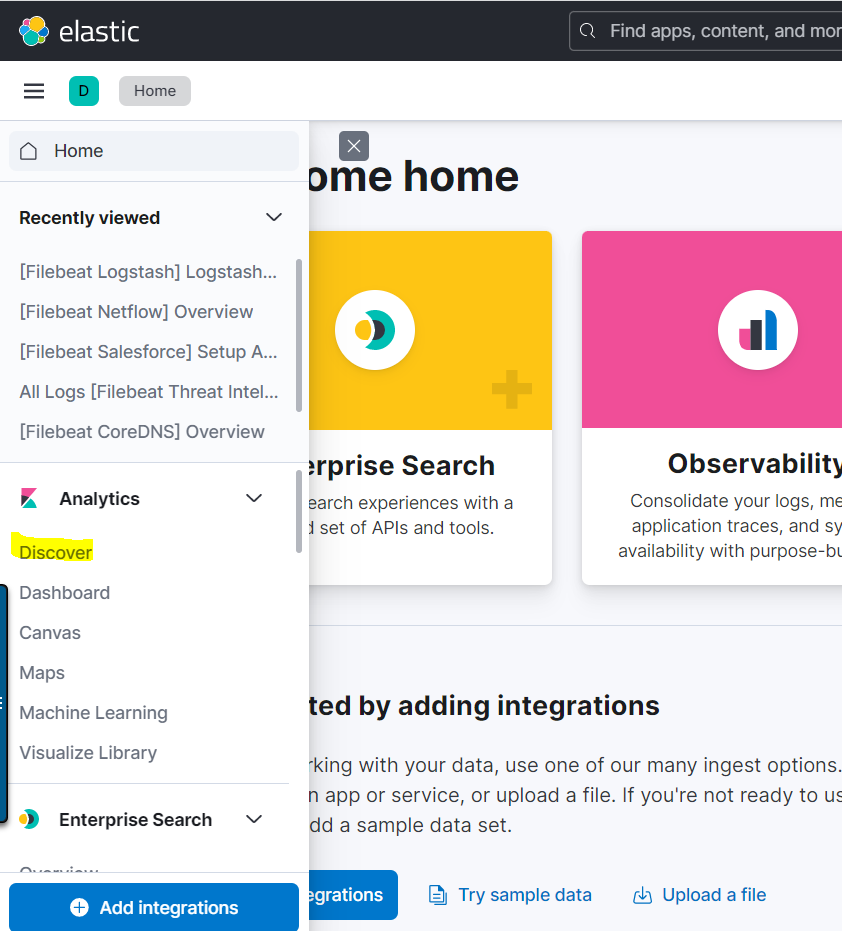
Inside Discover, you should see the logs:
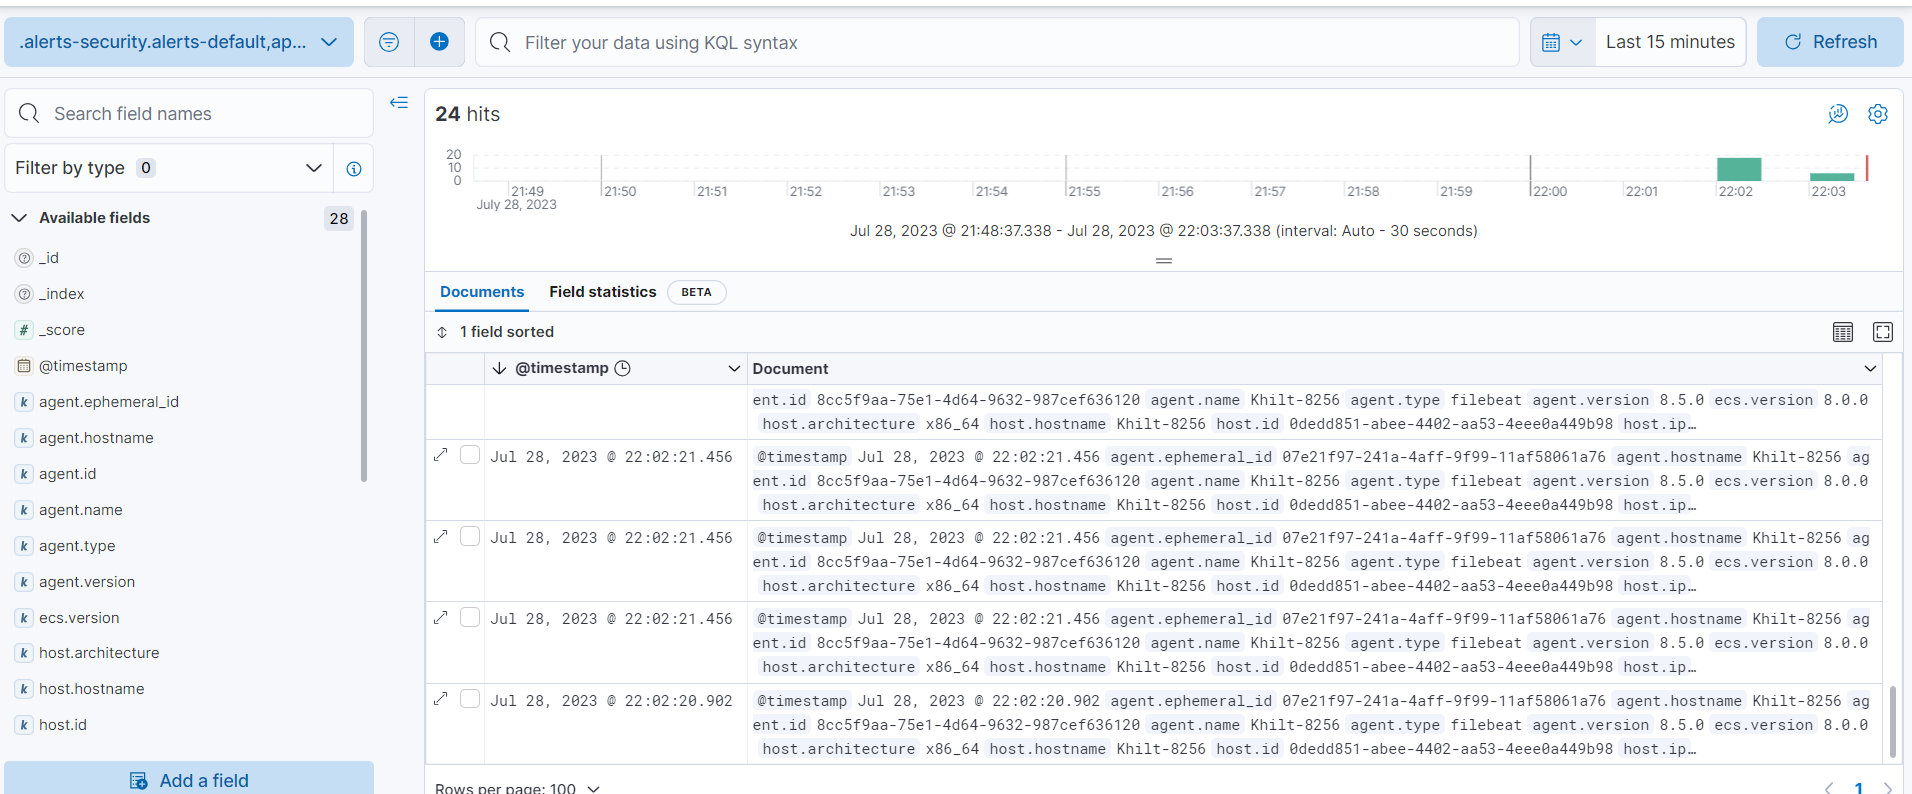
Here you can see the same logs that we generated from IBM ACE on file which is printed in the message array on ELK.
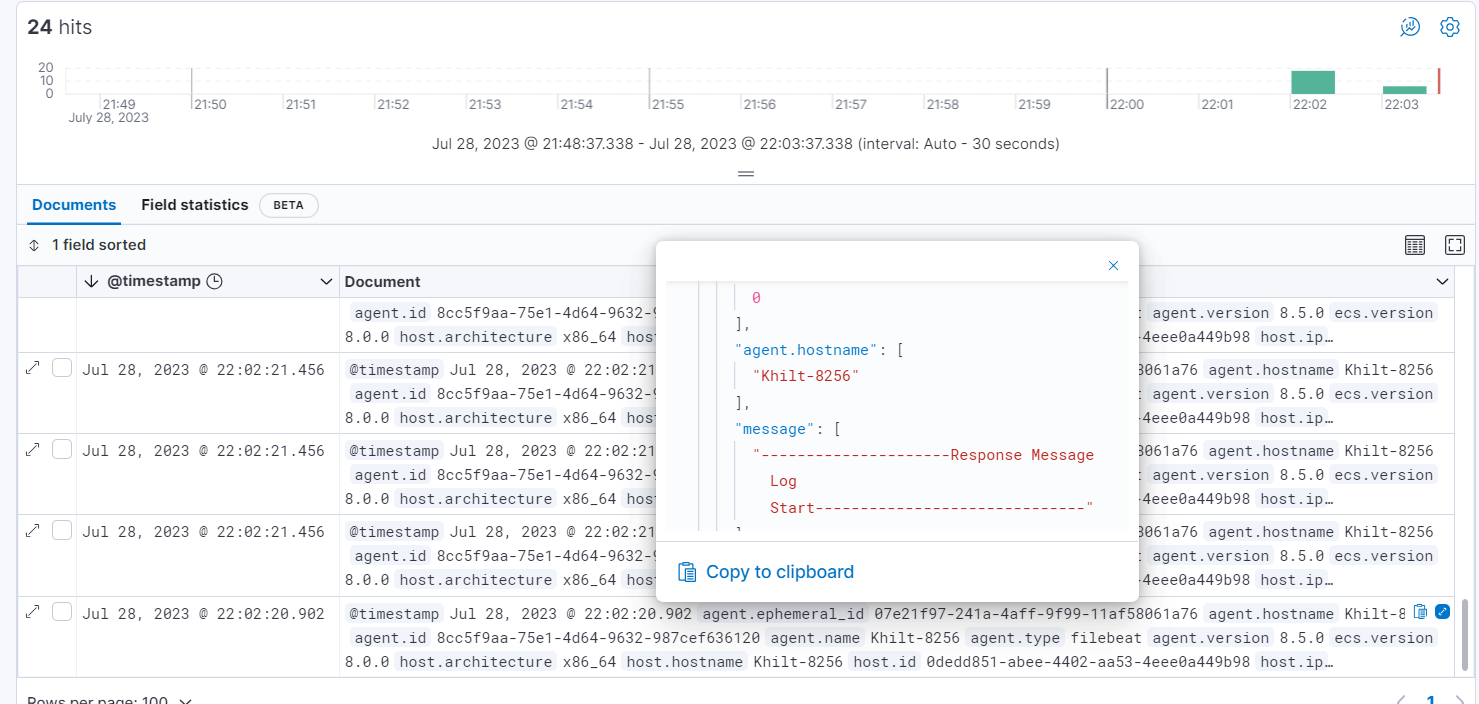
After displaying logs you can make them more valuable and focused by mapping only those fields that are most relative.
- For example, add only relative fields in the view:
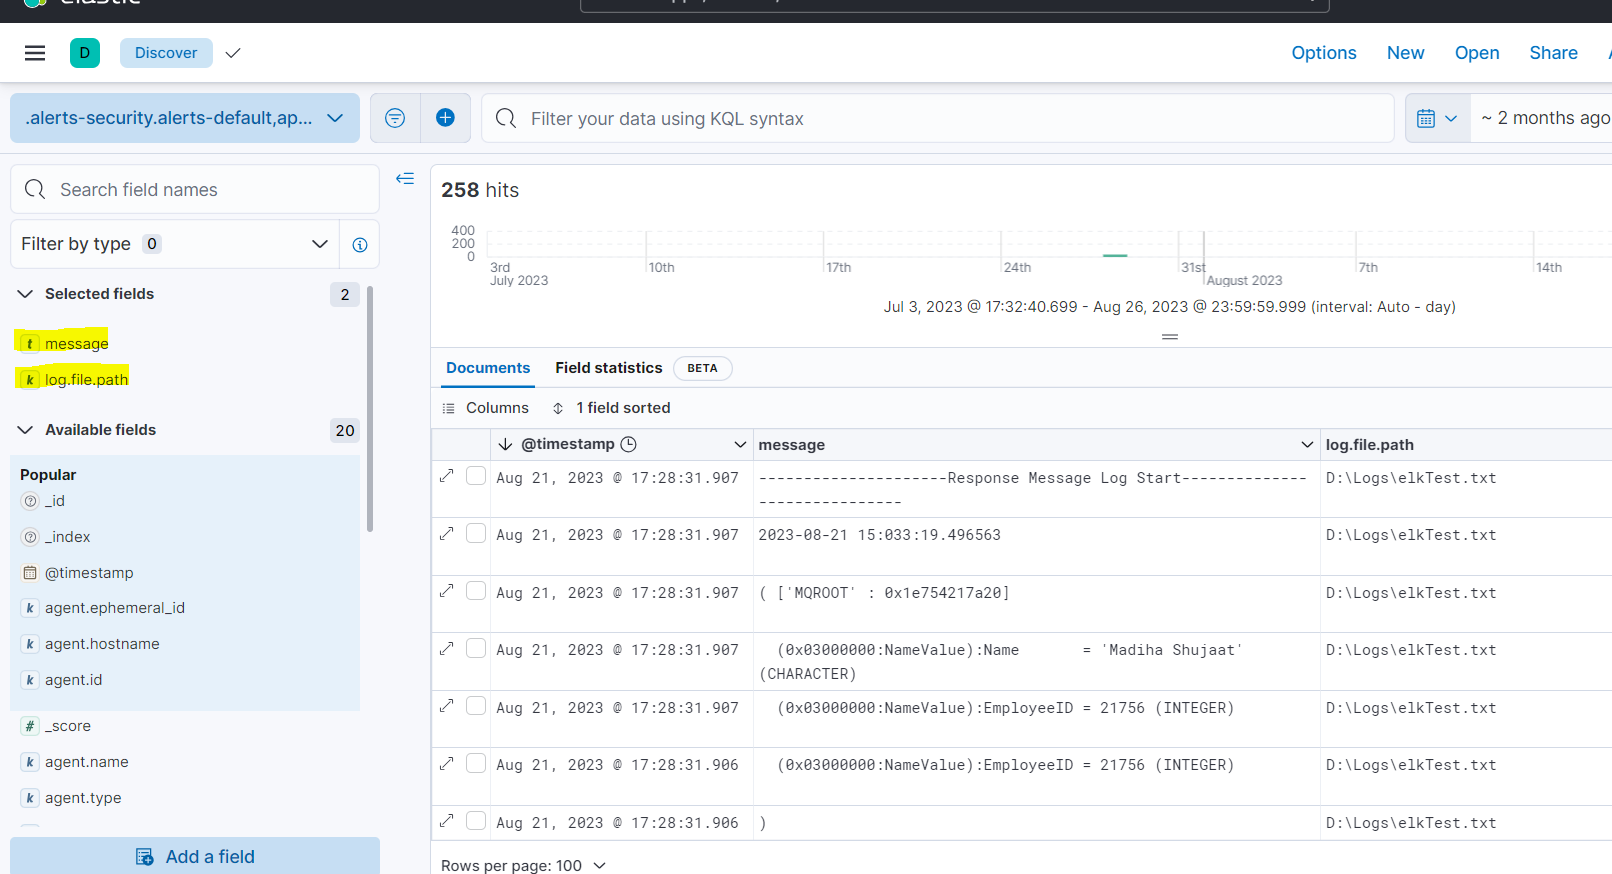
You can also customize your view in kibana by mapping graphically only those instances which are making an impact and are important.
Understanding of Terms
Following are the terms you will go through while setting up Elastic search.
- Name: the property for the set of configurations you can set
- Indices: In Elasticsearch,"indices" refer to the patterns used to read metrics data and log data from its data structures.
- Fields: These are specific names given to individual objects in the Elasticsearch indices, and they play a crucial role in querying and interpreting the data accurately.
- Log columns: Within a log stream,"log columns" represent the various attributes or pieces of information displayed horizontally to facilitate log analysis.
- Timestamp: The timestamp in the log entry is derived from the "timestamp" field, indicating the time when the log was recorded.
- Message: The "message" field contains the content extracted from the log document. The actual content within this field depends on the type of log message. If a specific log message type cannot be determined, the Elastic Common Schema (ECS) base field," message," is used instead.