Flow Monitoring Using MQ Pub/Sub Broker in IBM App Connect Enterprise
Written By: (Yasharah Mirza Junior Consultant, Integrations Framework)
This article will help you achieve flow monitoring using MQ Pub/Sub Broker.
Let us start with the basic concepts first.
What is Flow Monitoring?
Flow Monitoring monitors and captures information from the flows to have visibility on messages travelling between systems.
What is a Monitoring Event?
Monitoring Event is an XML document that is being emitted by ACE when something interesting happens.
Uses of Monitoring Events:
1- We can speed up the process of exception identification.
2- It provides developers and supports people with a great level of visibility on requests/responses and other payloads travelling between systems.
3- Events are typically emitted to support transaction monitoring, transaction auditing, and business process monitoring.
Types of Monitoring Events:
There are four types of events we can capture in ACE as shown below.
Event Customization:
We can customize events produced by message flow by following two methods.
1- Monitoring Properties: Customize events via monitoring properties when you are designing message flow.
2- Monitoring Profile: If you want to customize events after a message flow is deployed, but without redeploying, use a monitoring profile.
In this article, we will see event customization via Monitoring Profile.
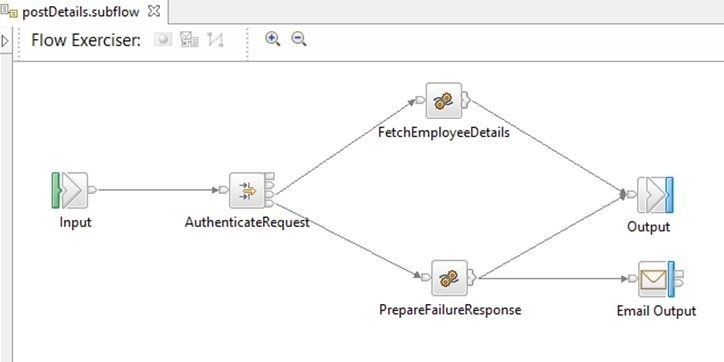
This is the flow for which we will configure the monitoring profile and activate flow monitoring.
Event Customization by Monitoring Profile:
What is a Monitoring Profile?
A monitoring profile is an XML document that specifies event sources in a message flow that will emit events and the properties of those events.
Let's see how to configure events in the monitoring profile.
The root element is the monitoring profile. It contains one or more eventSource elements. Each event source element contains:
- eventPointDataQuery
- applicationDataQuery
- bitstreamDataQuery
The following example of a monitoring profile XML document contains a single event source to illustrate the structure.
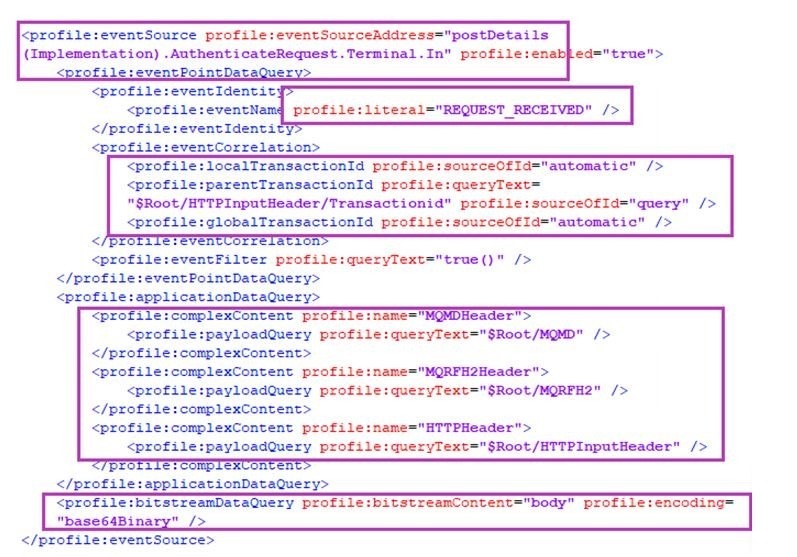
1- eventSourceAddress It will have the source address of an event (node labels) that needs to be captured.
- postDetails (Implementation) is a subflow name.
- AuthenticateRequest is a node name present inside postDetails (Implementation)
- Terminal is a keyword
- In is the terminal name
2- eventPointDataQuery This element provides key information about the event.
a. literal: It can be any of the keywords that describe the type of transaction. For instance RESPONSE_RECEIVED, REQUEST_SENT, REQUEST_RECEIVED, RESPONSE_SENT, EXCEPTION, etc.
b. localTransactionId, parentTransactionId, and globalTransactionId: Three correlation attributes are available for you to use in your events. The exact usage of the correlation attributes varies depending on the requirements. In this case, Local and Global Transaction Id is set to automatic whereas parentTransactionId is set to transactionId received from Request.
3- applicationDataQuery This element contains contents if the event payload includes data fields that are extracted from a message. Complex contents differ w.r.t requirements.
4- bitstreamDataQuery In this element we describe bitstream data from a message (Bitstream data can be one of Headers, Body, All) and Encoding (Encoding can be one of CDATA, base64Binary, hexBinary). We are using body and base64 binary encoding as an example.
That is it about configuring events in the monitoring profile!
Once the monitoring profile has all the required events. Place the monitoring profile in the overrides folder of the Integration Server and Restart the Integration Server for changes to take effect. Overrides can be found in the following location.
<work directory>/overrides/<PolicyProject>/<MonitoringProfile>
In our case, it’s
C:\ProgramData\IBM\MQSI\components\ACENODE\servers
\ACEEG\overrides\POL_EMPAPI\EMPAPI.monprofile.xm
Publication and Subscription of Event Messages:
Once events are generated for required terminals, we need to publish event messages somewhere. We can use the following pub/sub-brokers.
1. The built-in MQTT pub/sub-broker
2. An MQTT pub/sub-broker on an external MQTT server
3. An MQ pub/sub-broker
4. A combination of MQ and MQTT pub/sub-brokers
In this blog, we will be using MQ pub/sub-broker.
Publication and Subscription of Event Messages using MQ Pub/Sub Broker:
When working with MQ pub/sub-broker, we need to know a few basic terms.
Topic: A named resource to which messages are sent by publishers.
Subscriber: Subscribers subscribe to the events from the topic and put them in a specified queue.
We will now create Topic and Subscriber in IBM MQ. Events produced during this will be sent to Topic by ACE Node and the subscriber will then subscribes to the message and send them to a defined Queue.
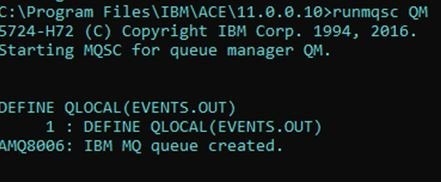
1. Create one Queue in Queue Manager associated with your ACE Node
2. Create a Topic with a Topic String.
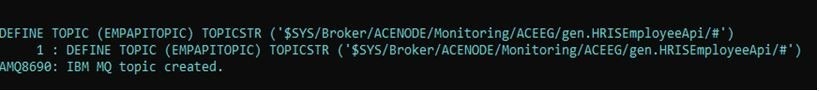
Topic String: A topic string is a character string that identifies the topic of a publish/subscribe message. You can use any characters you like when you construct a topic string. For an MQ pub/sub-broker, the topic root is $SYS/Broker. For example,
$SYS/Broker/integrationNodeName/Status/ExecutionGroup/integrationServerName
I have used # to include all flows under gen.HRISEmployeeApi. All events created for gen.HRISEmployeeApi will go to EMPAPITOPIC. Make sure to include the schema name as well, like gen here.
3. Create a Subscriber. There can be multiple subscribers to a single topic.
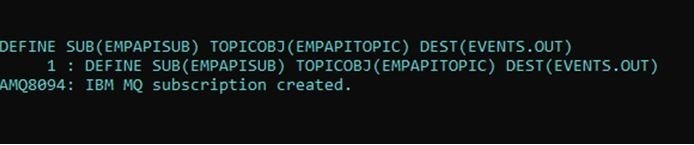
Attach policy in the server’s YAML file as shown in the following snapshot. In this case, POL_EMPAPI is a policy project and EMPAPI is monitoring profile name, and activating monitoring.
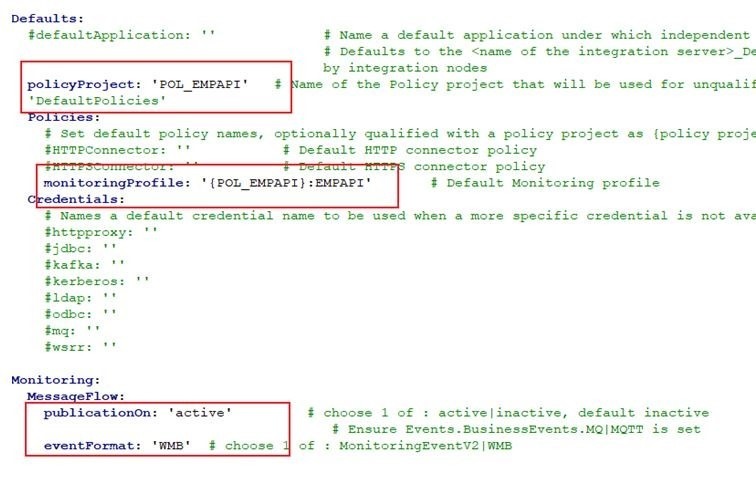
After making changes to the server’s YAML file restart the integration server.
Once all these configurations are done. Run your API and see the destination queue. In our case it’s EVENTS.OUT.
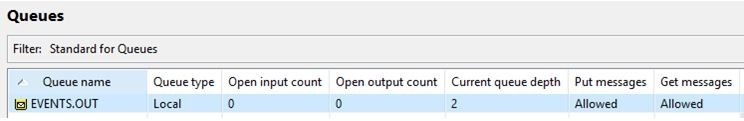
Two messages have there in a queue since I configured events for AuthenticateRequest.Terminal.In (i-e, request) and FetchEmployeeDetails.Terminal.Out(i-e, response) event sources addresses. These payloads in a queue have all the necessary information that can be logged next at the DB level or ELK(Elasticsearch, Logstash, Kibana), etc.
Happy Learning!